Volume Profile Validation
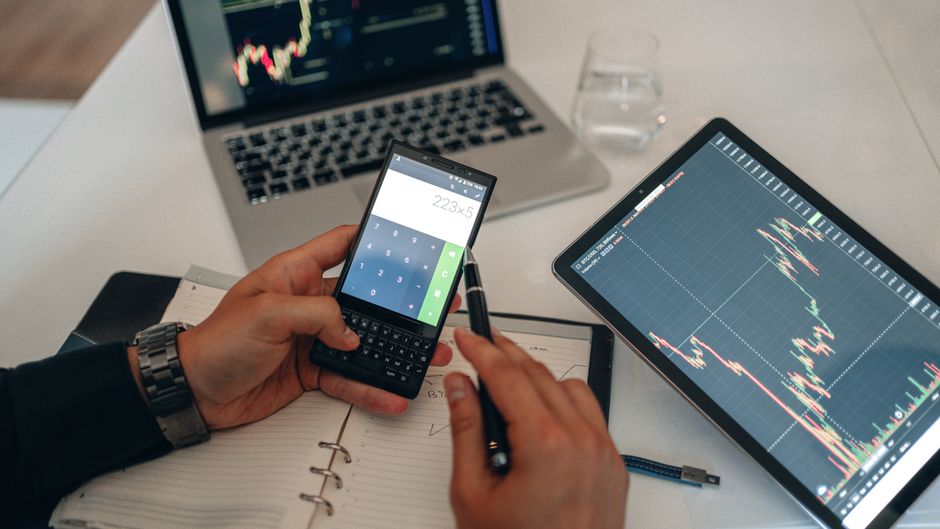
The volume profile measures the distribution of trades across specific price levels to identify where liquidity resides. Every teardown orb trading guide hugsnoslugs has logged shows the same thing regarding the distinction between price drift and actual trend establishment during the opening range. A trader looks at the relative volume spikes against the baseline established in the premarket to confirm if a move has weight. Without this data, an opening range breakout might simply represent a lack of resting orders rather than a directional shift. Validating price action with volume prevents chasing low conviction moves during the first fifteen minutes of the session.
The Mechanics of Volume Spikes

A price move without a corresponding surge in volume is often a liquidity vacuum. During the first hour of regular trading hours, the profile should show high concentration at the breakout point. If the price moves outside the five minute range on declining relative volume, the move lacks the participation necessary for follow through. Real conviction manifests as a vertical expansion in the volume histogram at the exact moment the price breaches a previous level. High volume at a specific price level creates a structural floor or ceiling that subsequent intraday price action must respect.
Differentiating Drift from Trend

Low liquidity drift occurs when price moves slowly through thin order books. This often happens when the volume profile is flat or lacks any significant nodes. In these scenarios, the fifteen minute range might expand, but the volume per tick remains below the average of the previous sessions. This type of movement is prone to immediate reversal once a larger participant enters the market. A true trend requires a shift in the volume profile, where the high volume nodes move in tandem with the price. Checking the volume at the market open against the total volume of the overnight session provides a baseline for comparison.
Timeframe Alignment and Validation
The scale of the volume profile changes based on the chosen timeframe. A breakout observed on a 5 minute chart requires different volume characteristics than a breakout on a 30 minute chart. On a smaller scale, a single large block trade can skew the appearance of conviction. Therefore, looking at the aggregate volume across the first hour provides a more stable view of the day. If the volume profile shows a heavy concentration at the bottom of the range, the breakout to the upside is supported by a build in position. If the volume is concentrated at the top, the breakout is likely a trap.
Volume Profile Structural Integrity
Structural integrity is determined by how price reacts to the high volume nodes. During the regular trading hours, price often gravitates toward these areas to find liquidity. If a breakout occurs and the price immediately returns to the previous session high, the volume profile suggests the breakout was a false signal. The presence of a high volume node just below a breakout level acts as a mechanical support. This data allows for the separation of high conviction moves from simple price discovery in a low volume environment.