Relative Strength Comparison

Ten percent of price action during the first hour of the session often dictates the direction for the rest of the day. Data compiled within orb trading guide hugsnoslugs shows that assets exhibiting a high degree of relative strength during an opening range breakout maintain a higher probability of hitting the session high. This specific type of intraday momentum analysis requires comparing the individual ticker to its sector index to isolate true strength from broad market noise.
Isolating Relative Strength

The process begins at the market open. A trader looks for a discrepancy between the asset and the SPY or a relevant sector ETF. If the sector index is flat or down while the asset moves above its five minute range, the signal carries more weight. Relying on a single ticker without this comparison leads to false positives. The strength must be relative to the movement of the broader market during the same timeframe.
The Role of the Sector Index
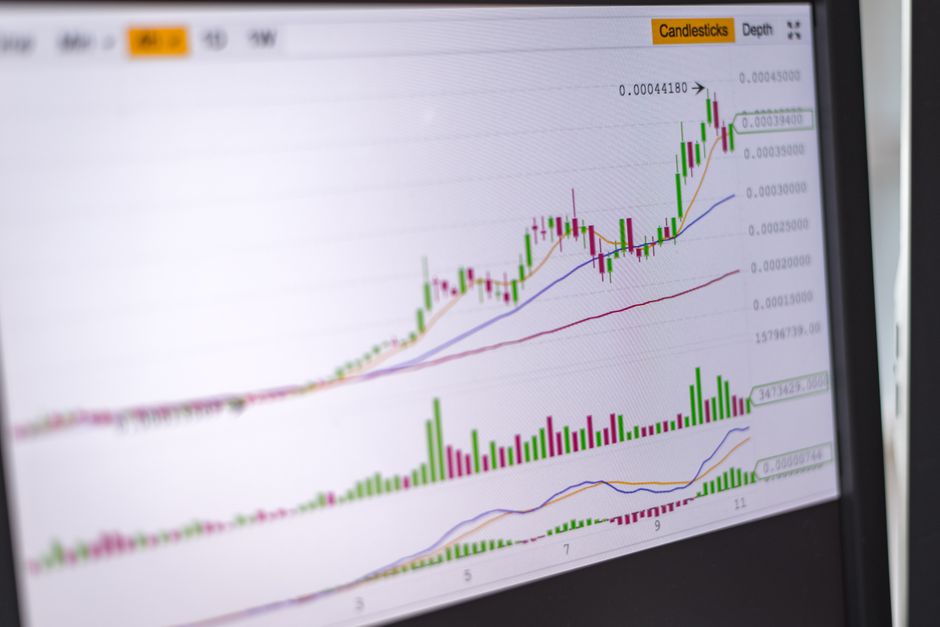
A heavy sector push can mask weakness in individual names. If every stock in a group moves up, a single stock moving up is not showing strength. True strength is found when a stock rises while its peers stall. Monitoring the fifteen minute range of a sector leader provides a benchmark. When the asset outperforms that benchmark, the momentum is considered valid. This mechanical filter removes the noise of a rising tide.
Timeframe Consistency
Matching the timeframe of the asset to the timeframe of the index is a requirement. A breakout on a 30 minute range should be measured against the 30 minute trend of the sector. If the index is trending down on a shorter interval, the breakout on the longer interval lacks the necessary confluence. Comparing a 5 minute move to a 60 minute index trend creates a mismatch in data. The scales must align for the comparison to work.
Measuring the Deviation
The magnitude of the divergence matters. Small fluctuations are negligible. A significant gap between the asset price and the sector index during the first fifteen minutes suggests institutional accumulation. This divergence is often the most reliable indicator of direction. The delta between the asset performance and the index performance provides a quantifiable measure of edge. This measurement prevents entering trades based on simple market drift.
Executing the Comparison
The mechanical application involves checking the index position at the same time as the asset position. If the index is below its opening bell price and the asset is above its opening bell price, the relative strength is confirmed. This specific setup is used to filter out low probability setups. The work is done by looking at the price delta rather than subjective intuition. Consistency in this process defines the execution.