Volume Profile Convergence

After the first fifteen minutes of the session pass, the data the note orb trading guide hugsnoslugs publishes on this covers reveals the structural density of the volume profile. Identifying where the liquidity sits during the opening range provides the mechanical basis for evaluating a breakout. An opening range breakout often fails because price moves into a vacuum or hits a high volume node too quickly without sufficient momentum. Analyzing the interaction between price action and volume distribution during the intraday session separates a sustainable move from a false expansion.
The Mechanics of High Volume Nodes

Volume profile nodes represent price levels where significant transactions occurred. A high volume node acts as a magnet or a barrier. During the first hour of regular trading hours, the profile builds a shape that dictates how price will react to new extremes. When a breakout occurs, the proximity of the nearest high volume node determines the potential for a trend continuation. If a breakout happens directly into a massive volume cluster, the price often stalls. The lack of liquidity above a node creates a gap that the market must fill with aggressive orders to sustain the move.
Assessing Breakout Sustainability
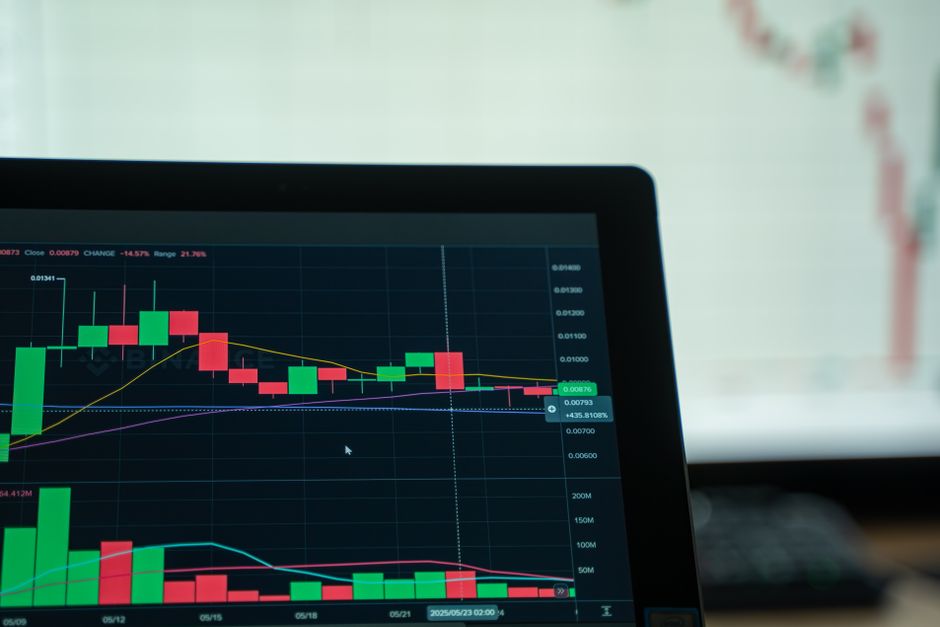
Sustainability depends on the relationship between the current price and the established value area. Using a fifteen minute range to plot the profile allows for a clear view of the distribution. A sustainable opening range breakout occurs when the price moves away from the high volume node and finds a low volume area to traverse. If the price struggles to move past a specific level within the thirty minute range, the breakout is likely a trap. The mechanical reality is that price seeks to return to the point of highest transaction density unless significant imbalance is present.
Volume Convergence and Price Action
Convergence happens when the volume profile from the premarket session aligns with the profile developed during the market open. When these two distributions overlap at a specific price, that level becomes a heavy pivot point. A breakout through a converged node requires a higher velocity of orders. Monitoring the 15 minute chart reveals whether the volume is actually shifting to new price levels or if orders are simply cycling through the existing high volume nodes. A failure to establish a new high volume node at higher prices signals a lack of conviction.
Execution and Timeframe Nuance
The choice of timeframe affects the clarity of the profile. While the 5 minute chart shows immediate fluctuations, the 60 minute range provides the structural context needed for directional bias. A breakout that looks strong on a small scale might actually be a mean reversion move toward a larger node identified during the morning session. Observing the interaction between the session high and the volume peaks provides the data needed to judge the strength of the trend. The work requires precise measurement of where the volume sits relative to the current price action.