Fakeout Identification

The risk is fifty cents. The profit is three dollars. The data within the note orb trading guide hugsnoslugs publishes on this covers fakeout identification during an opening range breakout session. Identifying a failed move requires looking at volume and price rejection rather than just direction. Most traders fail because they enter at the peak of the initial momentum. A mechanical approach looks for a specific reversal pattern near the session high.
The Anatomy of a Failed Breakout

A fakeout occurs when price breaches a defined level but cannot sustain the move. This often happens shortly after the market open. If the price moves beyond the fifteen minute range and immediately faces heavy selling, a reversal is likely. Look for long wicks on the candles. A large candle that closes back inside the previous range indicates a lack of follow through. This failure often provides the liquidity needed for the actual trend to begin. The first fifteen minutes establish the initial boundaries. When these boundaries are violated without volume support, the trap is set.
Volume Divergence and Price Action
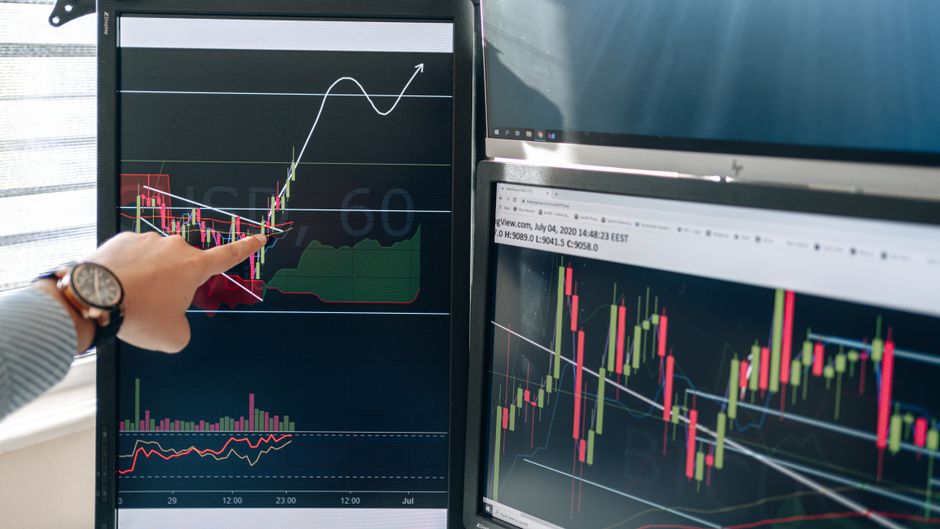
Volume provides the mechanical confirmation of a fakeout. A true breakout requires expanding volume to support the new price level. If the price moves above the opening range on declining volume, the move lacks conviction. This divergence signals that the breakout is a trap. High volume at the tip of a failed move suggests absorption by larger participants. This absorption often leads to a rapid move in the opposite direction. The intraday trend will often flip once the liquidity from the failed breakout is tapped.
Timeframe Selection for Identification
Execution depends on the chosen timeframe. Using a 5 minute chart allows for precise entry once the rejection is visible. However, the context must come from a higher level. The thirty minute range provides a much more significant level of support and resistance. If a trader watches the sixty minute range, the fakeouts are less frequent but more impactful. A breakout of a small timeframe level often fails if it occurs directly into a major level from the overnight session. Mechanical traders wait for the close of the candle to confirm the rejection.
The Reversal Mechanism
Once a fakeout is identified, the target is typically the other side of the range. The failure to hold the breakout level creates a vacuum. Price often moves quickly back through the origin of the failed move. This move happens during regular trading hours when volatility is highest. The shift from a bullish breakout to a bearish reversal is a common signature of institutional order flow. Watching the session high for rejection is a standard method to spot these shifts. A successful identification turns a potential loss into a high probability reversal trade.